


Reporting
This chapter describes how to use the Reporting module to produce a simple report on several indicators--the type you might use for monitoring and evaluating a program.
Although this chapter will cover the basics, as your OpenMRS implementation grows, you'll want to take advantage of the Reporting module's additional features like:
- Multiple types of indicator-based reports,
- Quick ways to break down indicators based on gender, age groups, etc.,
- Several kinds of patient reports,
- The ability to schedule regular reporting,
- Easy formatting options for printed output using Excel templates, and
- An API that Java developers can extend to add custom reports, indicators, and displays.
The module's full functionality is beyond the scope of this book. You can find further documentation on the OpenMRS Wiki:
http://go.openmrs.org/book-reporting
This chapter follows after the ones on Data Entry, because you cannot actually build reports without some data to run them on. But while planning the project you should follow the best practice of determining what outputs you want, and working backwards from there to determine the minimal set of data that you need to collect to produce those outputs.
Background and terminology
The reporting module is built around the idea of Definitions that are evaluated to produce output.
Reports and data sets
In general a Report Definition can have multiple Data Set Definitions. When run, this will produce a report with multiple data sets, which is rendered to a format chosen by the user.
Cohorts
Almost all reports produced with OpenMRS refer to groups of patients. A report may be run on different patient groups, or require identifying or counting sub-groups of patients. The module lets you define cohort queries (as discussed in the chapter "Cohort Builder"). When the report is run, these queries will be evaluated to produce actual cohorts of patients.
Indicators
In this chapter, we look at a report that is based on Indicators, and specifically indicators that look at the count of patients in a cohort in a period of time.
Parameters and mapping
Unlike in the OpenMRS Cohort Builder, reports and their underlying queries are intended to be created once, and reused. To support this idea, reports and queries usually take parameters. For example, a report intended to be run monthly would have Start Date and End Date parameters, and the user would be asked for these when they generate the report.
The underlying queries in the report also typically take parameters. If the report is going to display the number of patients enrolled in the Child Nutrition Study at the end of a given month, it would need to have an underlying Cohort Query for "patients enrolled in Child Nutrition Study on a date". That date would be an Effective Date parameter.
When the user runs the report, they are asked for a Start Date and an End Date, but they are not asked to specify an Effective Date. When designing the report, you will need to define how parameters in the underlying queries obtain their values, based on the values provided by the user when running the report. This process is called mapping.
The idea of mapping parameters is complicated. The following resources include more information about why it is necessary, and how to do it:
Amani Clinic's weekly report
 Before adopting OpenMRS, Amani Clinic used to spend significant time at the end of every month tabulating paper registers and patient charts to produce a monthly report for the Ministry of Health. When planning their OpenMRS implementation, they decided that to improve their program, they needed more immediate feedback. The clinic and Ministry of Health met and decided on five indicators on which they wanted a report every week. They modified their paper data collection forms to make sure that they were capturing the right data to produce those indicators, as well as the periodic Ministry of Health reports.
We'll focus on two of the indicators they calculated:
- Number of female patients seen during the week, and
- The percentage of those who were >16 years old, not pregnant, and using appropriate family planning
Defining the underlying cohort queries
Calculating the first of those indicators was very straightforward: they defined this to be any female patient having an encounter between the start and end of the week.
The second indicator was more complicated: they had to break down both the numerator and the denominator into multiple Cohort Queries. For the denominator they needed:
- Not pregnant ("no obs for Estimated Date of Confinement with a value in the future")
- Female
- Age > 16 at the end of the week
- Had an encounter during the week (same as the query for the first indicator)
The numerator required just one more Cohort Query, for patients who self-reported use of contraceptive methods other than "Natural Planning / Rhythm" during the week.
Building the report in the user interface
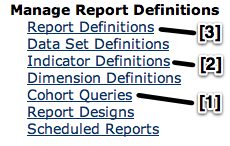
Having determined how to calculate their indicators, they proceeded to build them in the Reporting module's user interface. First, they build the low-level queries [1]. They then composed the two indicator definitions [2] from those cohort queries. Finally, they created a report definition [3] that included the two indicators.
Building cohort queries
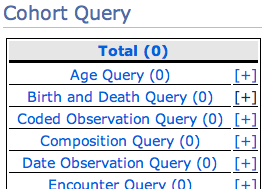
The Cohort Query management page shows you the different types of queries available. Clicking on any of the [+] links lets you create a new query of that type.
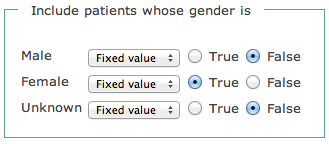
The simplest query built by Amani Clinic included only female patients:
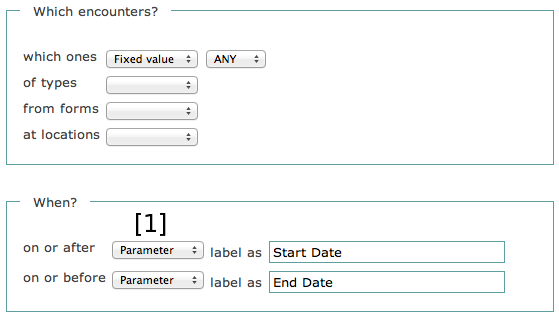
The rest of the queries needed to include parameters. For example, the query to find patients with any encounter between two given dates, the "on or after" and "on or before" fields were set as a Parameter [1] and a user-friendly names "Start Date" and "End Date" were provided.
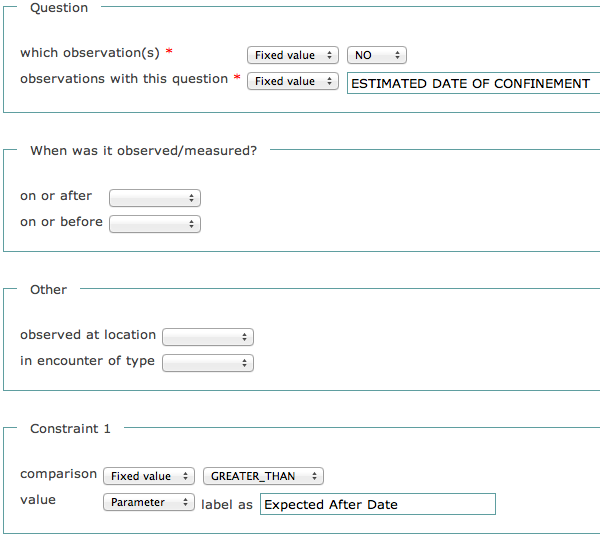
Some of the queries built in this example included parameters that weren't directly equivalent to the Start Date and End Date of the report. The "not pregnant" query was a Date Observation Query that included a single parameter, which they later mapped to the End Date of the report.
Combining cohort queries
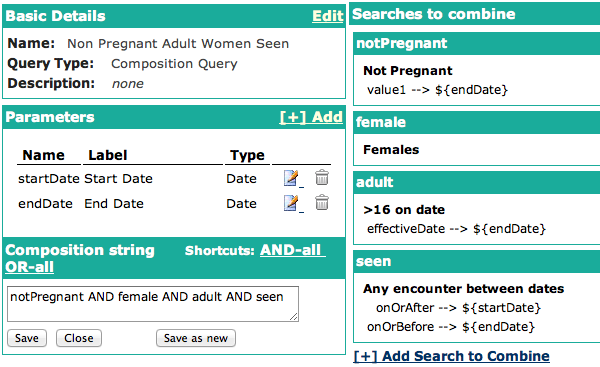
After Amani Clinic created the underlying queries that their report required, they built several Composition Cohort Queries to tie them together. The most complicated query calculated the denominator of the second indicator, "non-pregnant women, age > 16, seen during the week".
This is their composition query, which includes the two parameters Start Date and End Date. It includes four underlying queries, with values in those queries mapped to these two parameters. Finally, the queries are combined by AND-ing them all together.
Here, we see the seven cohort queries they built:

Indicators
Having built cohort queries to do the underlying calculations, they used these to build the two indicators. The Indicators page is accessed from the Manage Report Definitions section of the Administration page.
Since indicators are generally calculated over a time period, at a particular location, the indicators they created contain the default Start Date, End Date, and Location parameters. (Since the Amani Clinic was only managing a single site in OpenMRS, they ignored the Location parameter.)
Count indicators
The simplest type of indicator is a Count indicator, which counts the number of patients who match a Cohort Query.
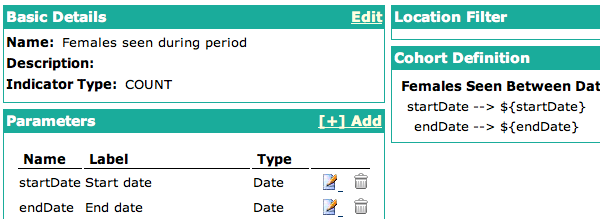
They used a Count indicator to build their first indicator, shown below. The underlying cohort query is a composition query including "Females" and "Any Encounter Between Dates".
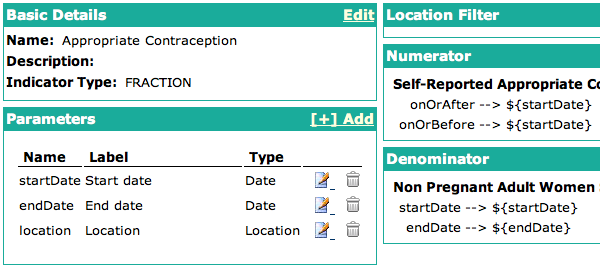
Fraction indicators
The most useful type of indicator for monitoring program progress is the Fraction indicator, which takes two cohort definitions representing a numerator and a denominator, and displays this as a fraction. (It ensures that the numerator patients are a subset of the denominator.)
Amani Clinic built their second indicator as a fraction indicator. The underlying cohort query for the numerator was a simple Coded Observation Query, while the denominator was the Composition Query described above.
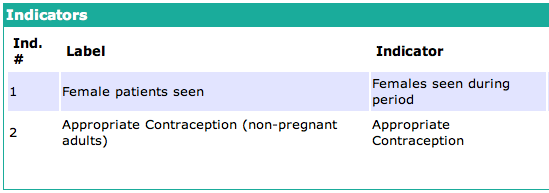
Period indicator report
Having created their indicators, they built a report that combined them. They used a Period Indicator Report, which a simple way to show the indicators you have already defined.
Running the report
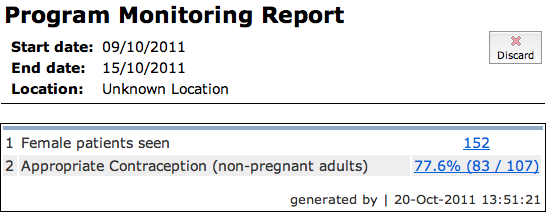
To run this report, the Amani Clinic data manager clicks the Reporting link on the top of the screen and selects the Program Monitoring Report. They must enter the start and end date of the week for which to generate the report.

The output of the report includes clickable links to the lists of patients matching each indicator.